ANalytic Process
Creator Behaviors UX Research (01)
ROLE
More App Users Behavior Study
CLIENT
MORE Social App
PLATFORMS
Mobile
Android
YEAR
2020
Overview
This ux study looks into user’s satisfaction and motivation on their use of competitive apps, to know the creator market in Nigeria, understand the development history and psychological state of social media creators, and lastly, the needs of users to grow within the digital creating industry.
Goal
- Understand creators’ motivations better position the product to suit their needs.
- Adopt other social platforms activities that users enjoy in the operations team.
- Understand user’s money-making model on other platforms.
- To improve user’s experience on More app.
Scope
Method
The evaluation of the MORE App was executed using the heuristic evaluation usability method, as provided by Jakob Nielsen. This method consists of evaluating a system using several evaluation criteria based on general set rules of thumb and not necessarily specific usability guidelines.
Research Process
Desktop Research
I conducted an online research on the available data on social media creators market in africa so we can better define the persona’s needed for getting interview participants.
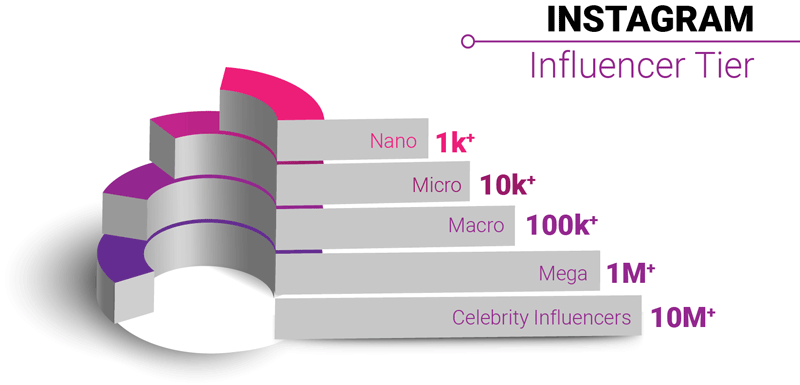
I also analysed the recent trends on the social media space like Instagram, facebook, youtube, twitter etc. I discovered influencer marketing is making users more money than traditional advertisements.
Questionnaire Design
The questions for the interview were designed to tackle each objective. A total of 10 questions with probing sub-questions to capture details where needed.
Interview
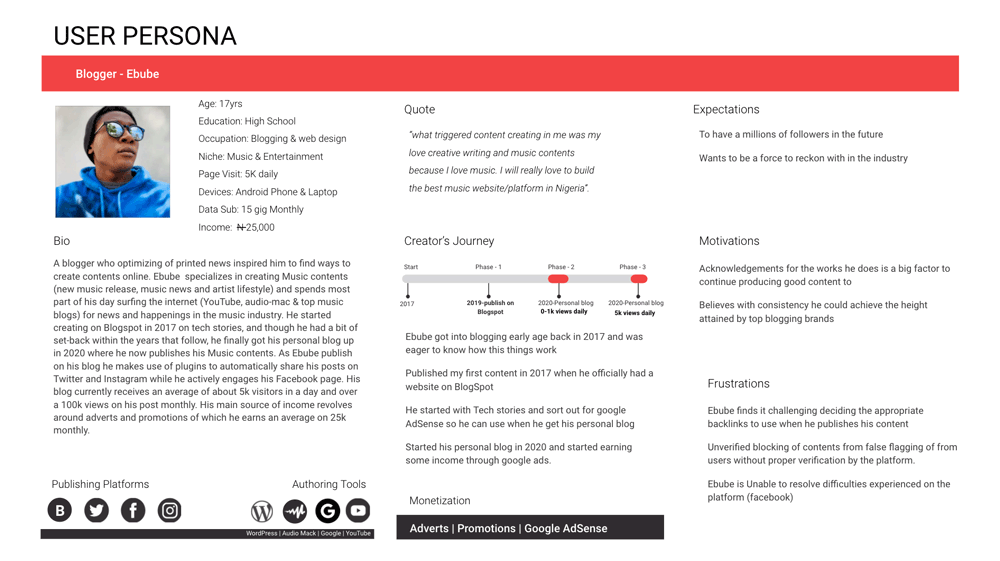
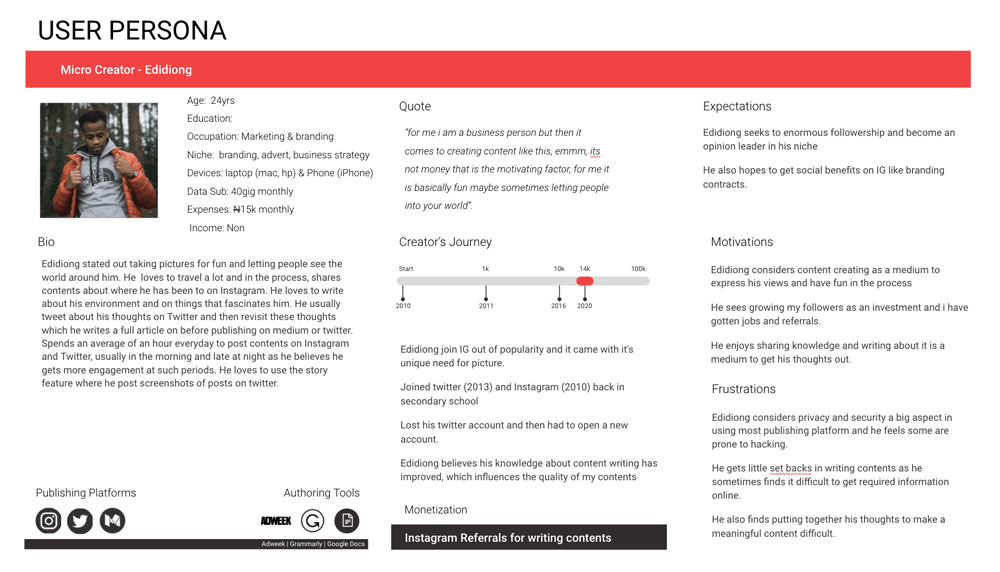
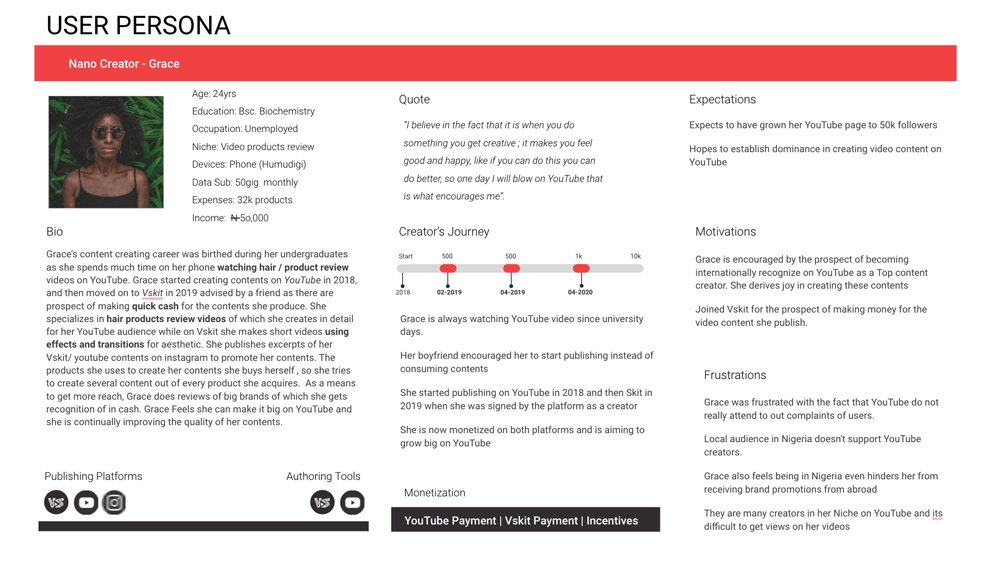
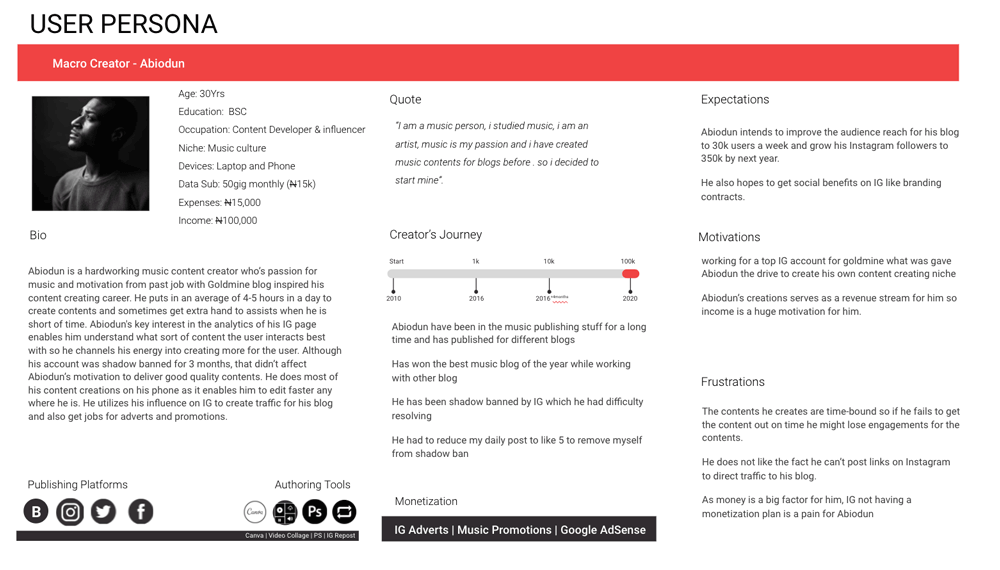
A qualitative interview was carried out by a Ux team of 3, consisting of a sample size of 16 respondents representing the four personas designed. Interview was done via phone call and with the consent of the respondent, the call were recorded.
Analytic Process
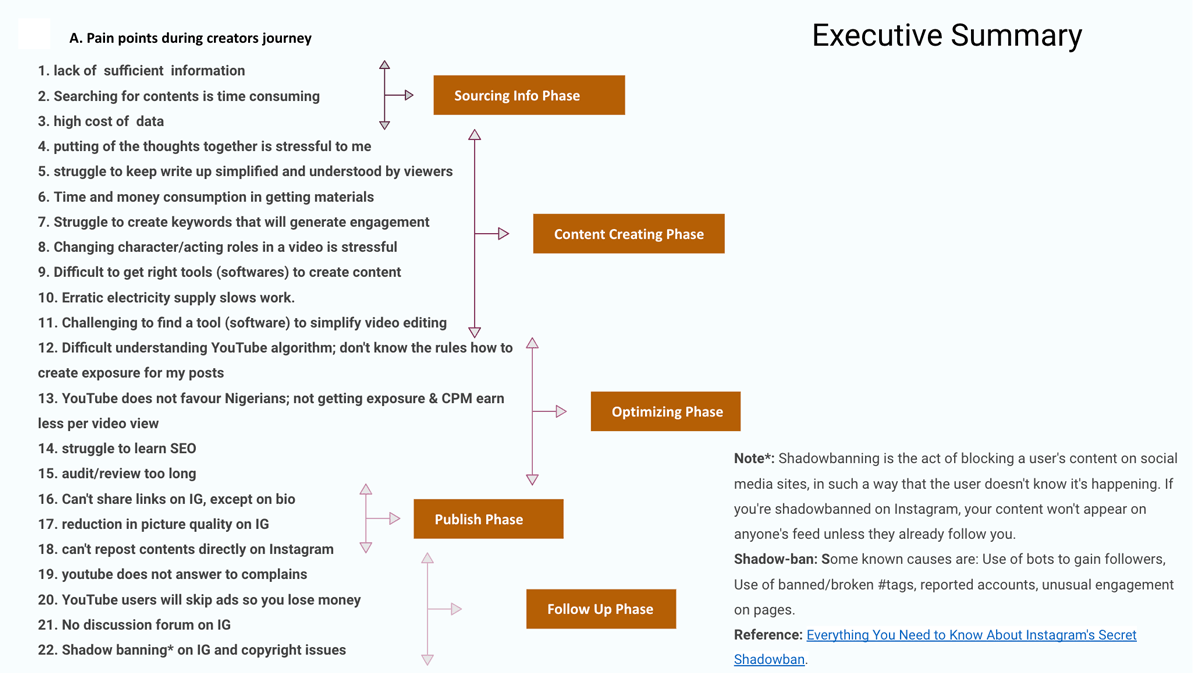
After the interview, the transcripts of the interview was recorded by my team as I conduct the interview. After, each interview session, I go through the transcript and fill in important details from the recording that are missing from the transcript.
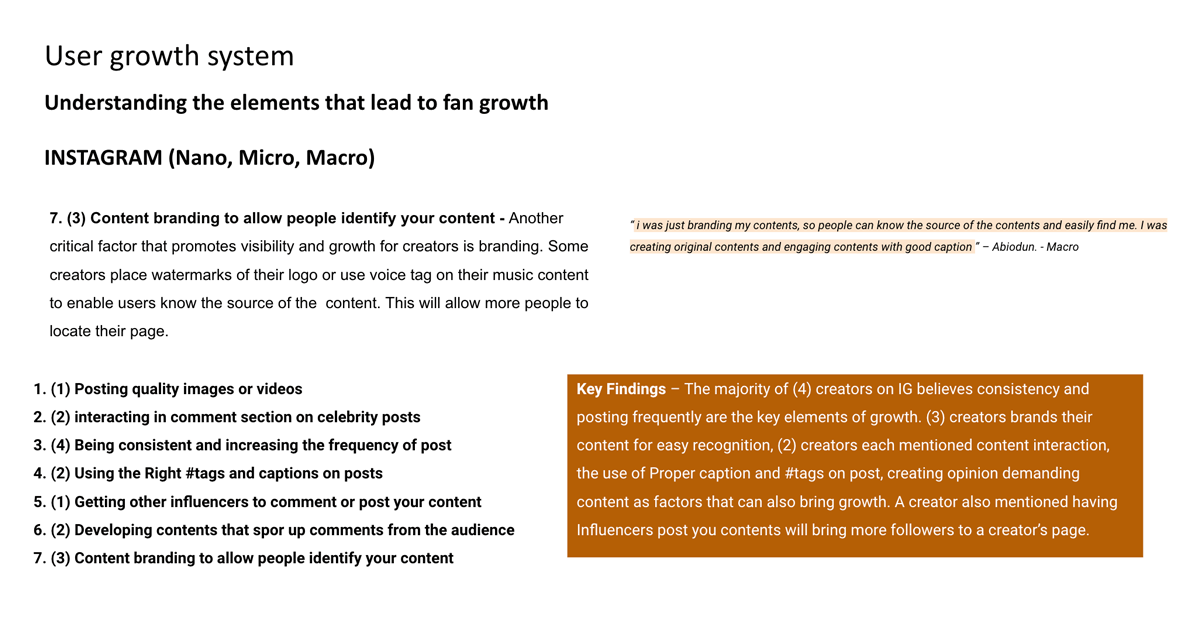
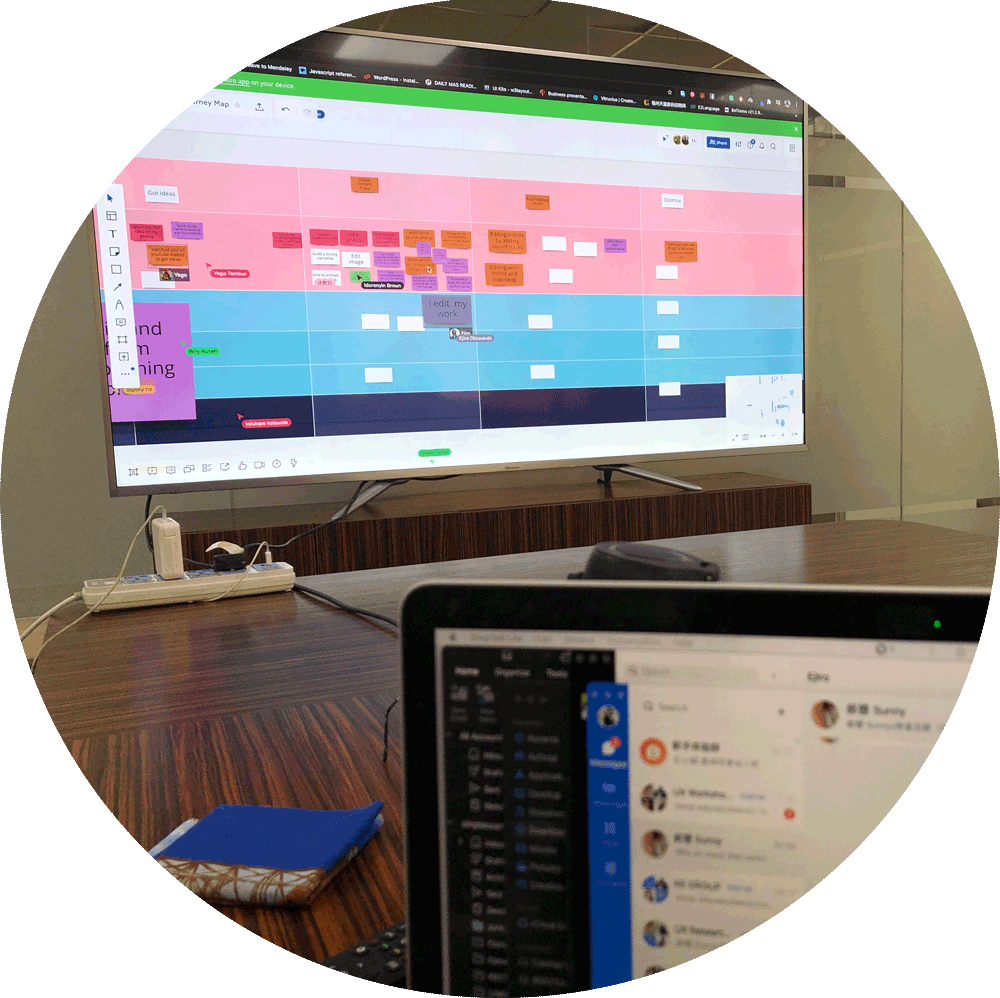
When all interviews completed, I created tags (coded in colors) which are used to analyze key points from the transcripts. After all color codes are completed by the team, we carried out comparative analyses of the data.
User Journey Workshop
Research Report
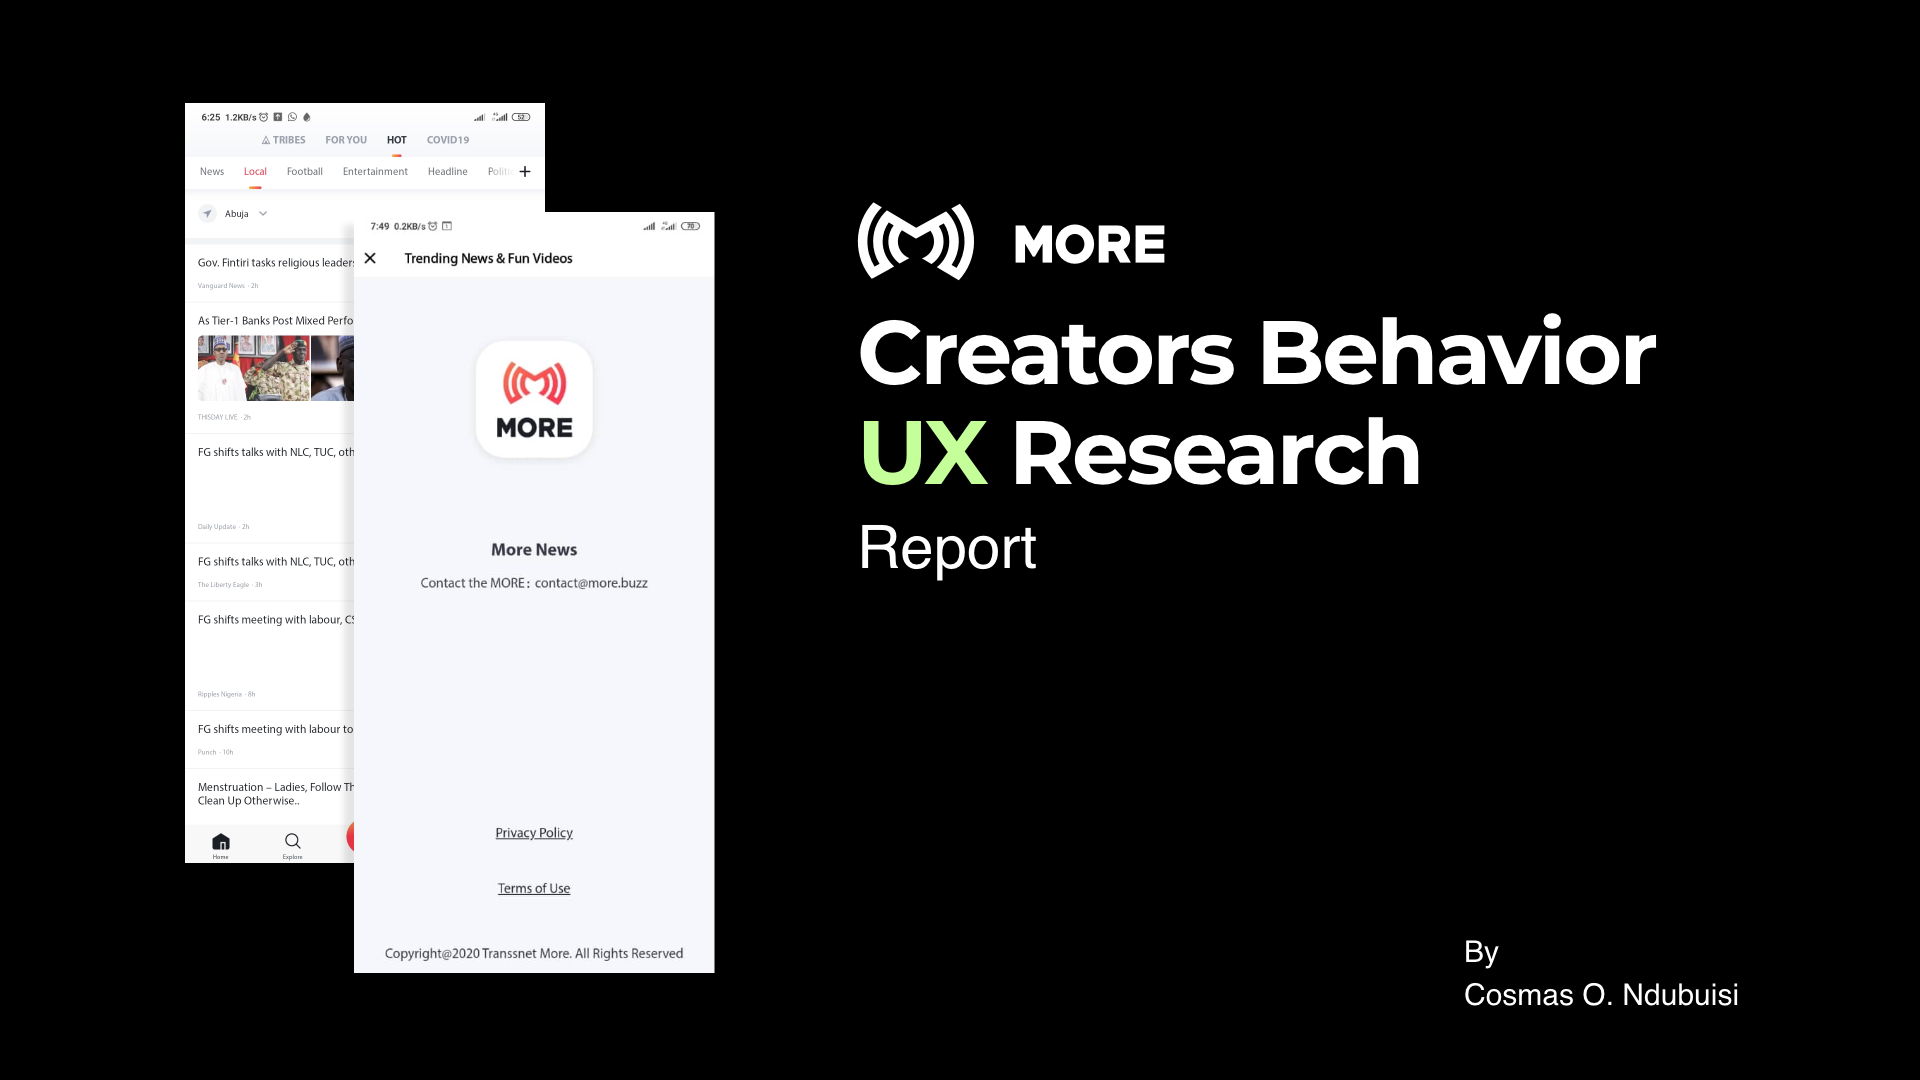
Report of the survey was delivered in a slide deck highlighting key findings for ease of understanding by top management.

